Three Years of Live Results, One Clear Story

A Growing Track Record
The S&P 500® Dynamic Intraday TCA Index aims for a 15% volatility target. Since its August 2023 launch, the index has generated a 33.53% cumulative return. Its growing live track record offers perspective beyond a single point in time. The six-month, 12-month, two-year and three-year trailing periods provide additional context for more informed index strategy conversations.
| Trailing period | Total return | Annualized return |
|---|---|---|
| 6 months | 9.38% | N/A |
| 12 months | 8.57% | 8.57% |
| 2 years | 12.32% | 5.98% |
| 3 years | 32.62% | 9.84% |
Using data from S&P Dow Jones Indices, we calculated the trailing return figures and reflect post-launch index performance. Market conditions have varied over the period shown, and the figures provide selected trailing return information as of September 3, 2026.
Choose the Strategy That Fits Your Client
With Enhanced Choice Index Plus 5, 7 and 10, four crediting strategies are available on the S&P 500 Dynamic Intraday TCA Index with rates are guaranteed for the entire surrender charge period.
- Cap Rate
- Par Rate
- Trigger Rate
- Trigger Rate Plus
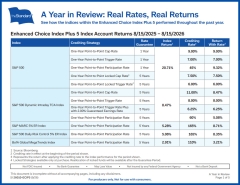
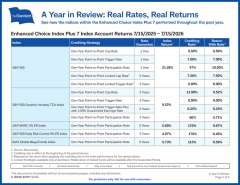
Each strategy offers a different approach to index-linked growth. Use A Year in Review flyers to see real rates and real returns on the Enhanced Choice Index Plus product.
A Year in Review: Real Rates, Real Returns
ECIP 5
More About Sales Insights & Tools


Related Products or Services

Doing business with The Standard is good for you and your clients. Our annuities offer innovative product design, desirable rates, competitive compensation, high industry ratings and excellent service.